Multiple Choice
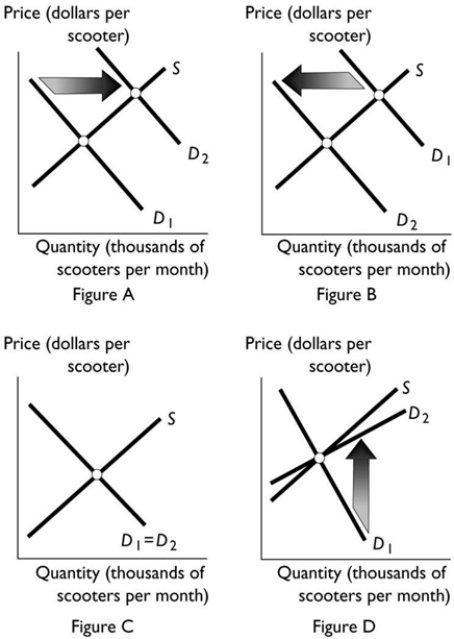 Scooters and bicycles are substitutes. Suppose the price of a bicycle falls. Which of the figures above best illustrates how this fall in price affects the demand curve for scooters?
A) Figure A
B) Figure B
C) Figure C
D) Figure D
E) None of the above answers is correct because the change in the price of a bicycle will affect the supply curve NOT the demand curve.
Correct Answer:
Verified
Related Questions
Q35: Q36: A scooter uses much less petrol than Q37: The graph illustrates the demand for peanuts. Q38: What happens to the demand for a Unlock this Answer For Free Now! View this answer and more for free by performing one of the following actions Scan the QR code to install the App and get 2 free unlocks Unlock quizzes for free by uploading documents![]()

