Multiple Choice
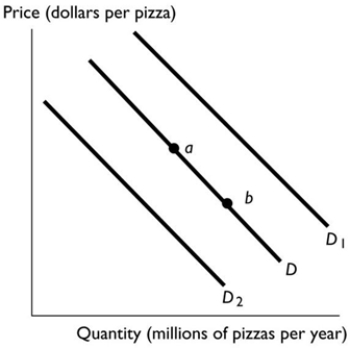 In the above figure, the movement from point a to point b reflects
A) an increase in the number of people who eat pizza.
B) a decrease in the price of pizza.
C) an increase in the demand for pizza.
D) an increase in the price of the tomato sauce used to produce pizza.
E) a decrease in the number of firms producing pizza.
Correct Answer:
Verified
Related Questions
Q34: Which of the following increases the demand
Q35: Q36: A scooter uses much less petrol than Q37: The graph illustrates the demand for peanuts. Q38: What happens to the demand for a Unlock this Answer For Free Now! View this answer and more for free by performing one of the following actions Scan the QR code to install the App and get 2 free unlocks Unlock quizzes for free by uploading documents![]()

