Multiple Choice
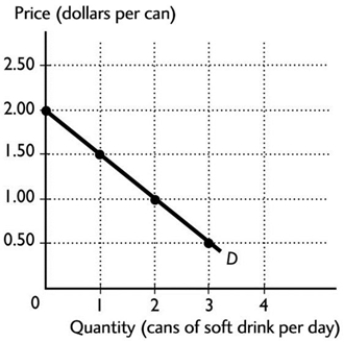 The graph illustrates the demand curve for soft drinks. After a rise in the price of a soft drink from $1.00 a can to $2.00 a can, the quantity of soft drinks demanded
A) decreases from 1 can to 0 cans a day.
B) remains unchanged.
C) increases from 0 cans to 2 cans a day.
D) decreases from 2 cans to 0 cans a day.
E) cannot be determined from the figure because the demand curve will shift to a new curve.
Correct Answer:
Verified
Related Questions
Q37: The graph illustrates the demand for peanuts.
Q38: What happens to the demand for a
Unlock this Answer For Free Now!
View this answer and more for free by performing one of the following actions

Scan the QR code to install the App and get 2 free unlocks

Unlock quizzes for free by uploading documents