Multiple Choice
Figure 2-5 shows monthly average (per unit) production costs for producing Good X. 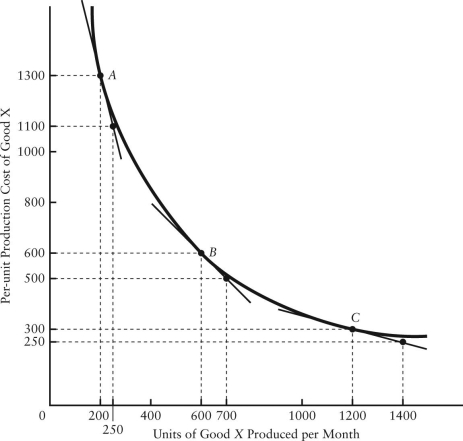 FIGURE 2-5 Refer to Figure 2-5.What is the slope of this non-linear function when 600 units per month are being produced?
A) -2
B) 4
C) -4
D) 1
E) -1
Correct Answer:
Verified
Related Questions
Q137: Q138: Suppose Jillian will spend $250 on books Q139: Q140: Q141: Q142: Q143: Figure 2-5 shows monthly average (per unit)production Q144: Figure 2-5 shows monthly average (per unit)production Q145: Q146: Unlock this Answer For Free Now! View this answer and more for free by performing one of the following actions Scan the QR code to install the App and get 2 free unlocks Unlock quizzes for free by uploading documents![]()
![]()
![]()
![]()
![]()
![]()
![]()

