The downward-sloping line in the diagram below shows the combinations of health care and education expenditures that the government can afford with a given amount of tax revenue. 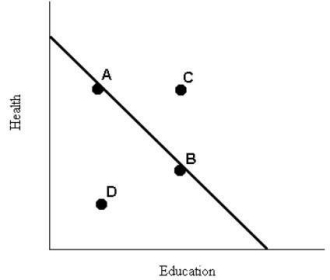 FIGURE 1-6 Refer to Figure 1-6.The levels of health and education expenditures at point C
A) are less than at point D.
B) are equal to those of point A and point B.
C) are more cost-effective than those at points A,B,and D.
D) could be achieved if the prices of health and/or education increased.
E) are not attainable with the government's current budget.
Correct Answer:
Verified
Q85: A move from inside the production possibilities
Q86: The downward-sloping line in the diagram below
Q87: Figure 1-7 shows the production possibilities boundary
Q88: The downward-sloping line in the diagram below
Q89: Suppose drought destroys many millions of acres
Q91: Figure 1-7 shows the production possibilities boundary
Q92: A modern economy like Canada's is largely
Q93: Figure 1-7 shows the production possibilities boundary
Q94: An important insight by Adam Smith,which was
Q95: The world price of oil fell in
Unlock this Answer For Free Now!
View this answer and more for free by performing one of the following actions

Scan the QR code to install the App and get 2 free unlocks

Unlock quizzes for free by uploading documents