Figure 1-7 shows the production possibilities boundary for an economy that produces two goods-cotton and bananas. 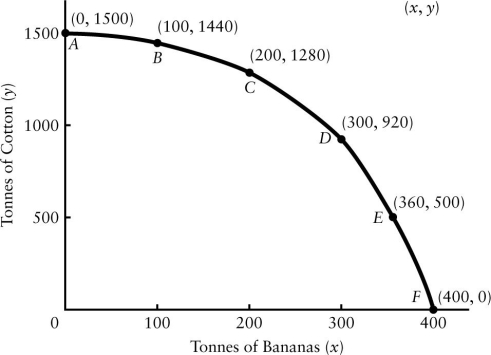 FIGURE 1-7 Refer to Figure 1-7.A production possibilities boundary is shown for an economy that produces two goods-cotton and bananas,both measured in tonnes produced per year.If the economy moves from point C to point D,what is the opportunity cost of each extra tonne of bananas produced?
A) 0.36 tonnes of cotton
B) 3.6 tonnes of cotton
C) 3.75 tonnes of cotton
D) 36 tonnes of cotton
E) 375 tonnes of cotton
Correct Answer:
Verified
Q86: The downward-sloping line in the diagram below
Q87: Figure 1-7 shows the production possibilities boundary
Q88: The downward-sloping line in the diagram below
Q89: Suppose drought destroys many millions of acres
Q90: The downward-sloping line in the diagram below
Q92: A modern economy like Canada's is largely
Q93: Figure 1-7 shows the production possibilities boundary
Q94: An important insight by Adam Smith,which was
Q95: The world price of oil fell in
Q96: Figure 1-7 shows the production possibilities boundary
Unlock this Answer For Free Now!
View this answer and more for free by performing one of the following actions

Scan the QR code to install the App and get 2 free unlocks

Unlock quizzes for free by uploading documents