Figure 1-7 shows the production possibilities boundary for an economy that produces two goods-cotton and bananas. 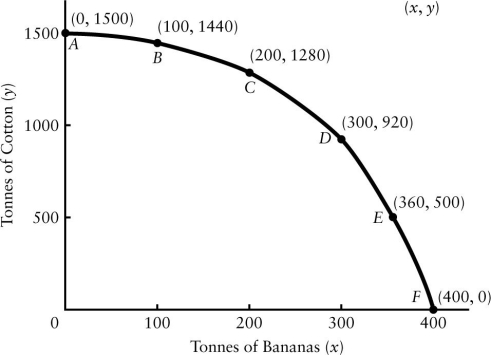 FIGURE 1-7 Refer to Figure 1-7.A production possibilities boundary is shown for an economy that produces two goods-cotton and bananas,both measured in tonnes produced per year.Suppose the economy is currently producing at point D.What is the opportunity cost of increasing production of bananas by 100 tonnes?
A) There is no opportunity cost.
B) 420 tonnes of cotton
C) 100 tonnes of cotton
D) 60 tonnes of cotton
E) 920 tonnes of cotton
Correct Answer:
Verified
Q82: Consider a production possibilities boundary showing the
Q83: Figure 1-7 shows the production possibilities boundary
Q84: Consider Canada's production possibilities boundary.Suppose fire destroys
Q85: A move from inside the production possibilities
Q86: The downward-sloping line in the diagram below
Q88: The downward-sloping line in the diagram below
Q89: Suppose drought destroys many millions of acres
Q90: The downward-sloping line in the diagram below
Q91: Figure 1-7 shows the production possibilities boundary
Q92: A modern economy like Canada's is largely
Unlock this Answer For Free Now!
View this answer and more for free by performing one of the following actions

Scan the QR code to install the App and get 2 free unlocks

Unlock quizzes for free by uploading documents