The diagram below shows the (hypothetical) demand and supply curves for regional jets in Canada.Assume that the market is competitive,all jets are identical,and that Canada engages in international trade.
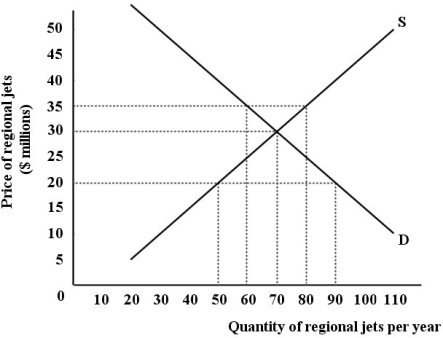 FIGURE 33- 6
-Since 1950,the world's real GDP has increased by seven times and the volume of world trade has increased by roughly
A) the same amount.
B) thirty times.
C) two times.
D) fifteen times.
E) ten times.
Correct Answer:
Verified
Q27: The diagram below shows the domestic demand
Q28: The figure below shows Arcticland's annual production
Q29: If the index of export prices increases
Q30: The diagram below shows the domestic demand
Q31: When opportunity costs differ between countries,
A)only the
Q32: When opportunity costs are identical between two
Q33: The figure below shows Arcticland's annual production
Q34: The figure below shows Arcticland's annual production
Q35: When specialization according to comparative advantage also
Q36: Consider Canada's terms of trade.Canadians consume millions
Unlock this Answer For Free Now!
View this answer and more for free by performing one of the following actions

Scan the QR code to install the App and get 2 free unlocks

Unlock quizzes for free by uploading documents