The figure below shows the marginal benefit to consumers,MB,the marginal cost to private firms,MCP,and the marginal cost to society,MCS,at each level of output of some good.
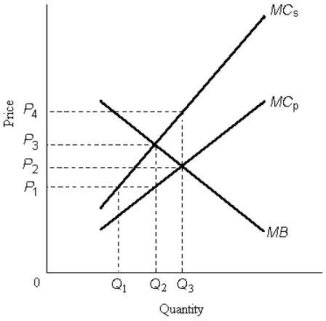 FIGURE 17- 1
-Refer to Figure 17- 1.The price that leads consumers to demand the socially optimal quantity of output is
A) P3.
B) P1.
C) P2.
D) zero.
E) not possible to know from the information given.
Correct Answer:
Verified
Q5: Two firms,A and B,are legally required to
Q6: The diagram below shows a market for
Q7: The diagram below shows the marginal cost
Q8: Suppose the government imposes an emissions tax
Q9: Consider a coal- fired electric- power plant
Q11: The figure below shows the marginal benefit
Q12: In a competitive market for tradable pollution
Q13: Suppose a firm producing roof shingles imposes
Q14: The figure below shows the demand and
Q15: When firms in an industry have fully
Unlock this Answer For Free Now!
View this answer and more for free by performing one of the following actions

Scan the QR code to install the App and get 2 free unlocks

Unlock quizzes for free by uploading documents