The diagram below shows the marginal cost of abatement for each of two firms,A and B.Each firm is initially abating Q0 units of pollution.
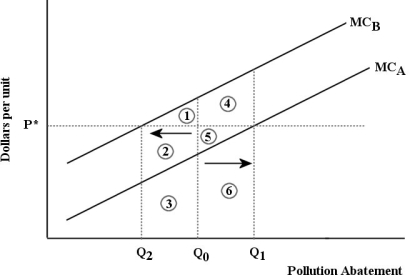 FIGURE 17- 6
-Refer to Figure 17- 6.Suppose that a system of tradable pollution permits is introduced into this market and the equilibrium permit price is p*.The effect will be that
A) Firm B will buy permits from Firm A,pollute less,and increase its costs by the areas 2+3; Firm A will sell permits to Firm B,pollute more,and reduce its earnings by areas 4+5.
B) Firm B will sell permits to Firm A,pollute less,and reduce its costs by the area 1; Firm A will buy permits from Firm B,pollute more,and increase its costs by the area 4.
C) Firm B will sell permits to Firm A,pollute more,and reduce its costs by the area 1; Firm A will buy permits from Firm B,pollute less,and increase its earnings by area 4.
D) Firm B will buy permits from Firm A,pollute more,and reduce its costs by the area 1; Firm A will sell permits to Firm B,pollute less,and increase its earnings by area 5.
Correct Answer:
Verified
Q15: When firms in an industry have fully
Q16: The diagram below shows the marginal cost
Q17: Consider global greenhouse- gas emissions.Suppose that in
Q18: The figure below shows the marginal benefit
Q19: Global greenhouse- gas (GHG)emission reductions are unlikely
Q21: Direct pollution controls can be inefficient because,for
Q22: The figure below shows the demand and
Q23: Suppose a farm that is polluting an
Q24: If residential garbage collection were financed by
Q25: Suppose a firm producing roof shingles imposes
Unlock this Answer For Free Now!
View this answer and more for free by performing one of the following actions

Scan the QR code to install the App and get 2 free unlocks

Unlock quizzes for free by uploading documents