The diagram below shows the marginal cost of abatement for each of two firms,A and B.Each firm is initially abating Q0 units of pollution.
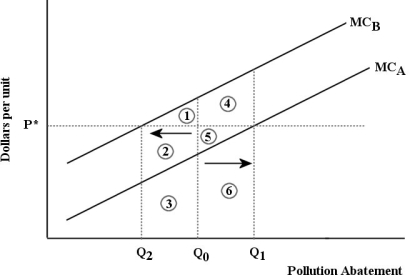 FIGURE 17- 6
-Private and competitive markets could produce efficient levels of pollution if
A) the worst polluting firms were closed down.
B) regulated by government through direct controls.
C) the producers were made aware of the pollution externality.
D) left alone by government regulators.
E) the appropriate tax per unit of pollution were administered and enforced.
Correct Answer:
Verified
Q11: The figure below shows the marginal benefit
Q12: In a competitive market for tradable pollution
Q13: Suppose a firm producing roof shingles imposes
Q14: The figure below shows the demand and
Q15: When firms in an industry have fully
Q17: Consider global greenhouse- gas emissions.Suppose that in
Q18: The figure below shows the marginal benefit
Q19: Global greenhouse- gas (GHG)emission reductions are unlikely
Q20: The diagram below shows the marginal cost
Q21: Direct pollution controls can be inefficient because,for
Unlock this Answer For Free Now!
View this answer and more for free by performing one of the following actions

Scan the QR code to install the App and get 2 free unlocks

Unlock quizzes for free by uploading documents