The diagram below shows demand and supply curves for some perfectly competitive market.
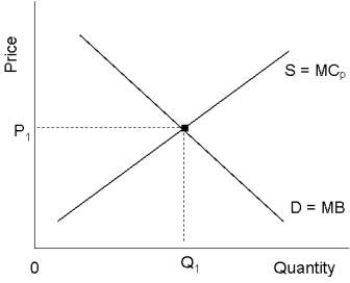 FIGURE 16- 2
-For a production process that involves a positive externality,it is true that
A) marginal social cost is more than marginal private cost.
B) a subsidy to producers could increase production to the socially optimal level.
C) a per unit tax could be imposed on the producer to achieve the socially optimal level of production.
D) marginal social benefit is less than marginal private benefit.
E) without government intervention the market will produce too much of this good.
Correct Answer:
Verified
Q61: The diagram below shows the marginal benefit
Q62: The main point about public choice theory
Q63: Consider a childhood vaccination program that is
Q64: The diagram below shows the marginal benefit
Q65: The diagram below shows the marginal benefit
Q67: A good example of a product that
Q68: An example of a public good is
A)air
Q69: Which of the following best explains why
Q70: The total costs of government intervention in
Q71: FIGURE 16- 1 ![]()
Unlock this Answer For Free Now!
View this answer and more for free by performing one of the following actions

Scan the QR code to install the App and get 2 free unlocks

Unlock quizzes for free by uploading documents