The diagram below shows the marginal benefit and marginal cost of a public good.This economy has 3 individuals,A,B and C.The diagram shows the MB for each individual and a summation of their marginal benefits.
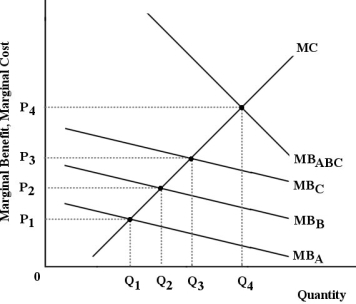 FIGURE 16- 4
-Refer to Figure 16- 4.Suppose the government provides Q4 units of the public good.If consumers were then required to pay a price of zero for the good,
A) the inefficient quantity would be being produced.
B) the market would clear,although not enough would be produced.
C) consumers would use the public good until their marginal benefit was zero,and this would be socially optimal.
D) consumers would use too little of the public good,and the outcome would be inefficient for society.
E) the appropriate price would be achieved,although not enough would be consumed.
Correct Answer:
Verified
Q60: In a free- market economy,
A)economic power is
Q61: The diagram below shows the marginal benefit
Q62: The main point about public choice theory
Q63: Consider a childhood vaccination program that is
Q64: The diagram below shows the marginal benefit
Q66: The diagram below shows demand and supply
Q67: A good example of a product that
Q68: An example of a public good is
A)air
Q69: Which of the following best explains why
Q70: The total costs of government intervention in
Unlock this Answer For Free Now!
View this answer and more for free by performing one of the following actions

Scan the QR code to install the App and get 2 free unlocks

Unlock quizzes for free by uploading documents