The diagram below shows the marginal benefit and marginal cost of a public good.This economy has 3 individuals,A,B and C.The diagram shows the MB for each individual and a summation of their marginal benefits.
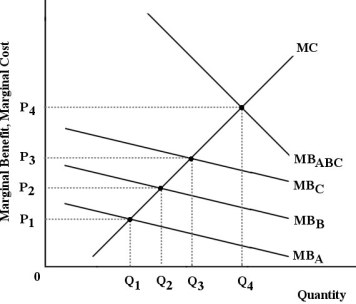 FIGURE 16- 4
-Refer to Figure 16- 4.The curve MBABC is derived by
A) a vertical summation of the marginal benefits of all individuals at each level of output.
B) observation of the consumption of public goods at a price of zero.
C) a horizontal summation of the marginal benefits of all individuals at each given price level.
D) observation of the consumption of public goods at the optimal price.
E) determining the private marginal cost of the public good.
Correct Answer:
Verified
Q56: Which of the following statements concerning cost-
Q57: FIGURE 16- 1 Q58: The diagram below shows the supply and Q59: Attempts by professional lobbyists in Ottawa to Q60: In a free- market economy, Q62: The main point about public choice theory Q63: Consider a childhood vaccination program that is Q64: The diagram below shows the marginal benefit Q65: The diagram below shows the marginal benefit Q66: The diagram below shows demand and supply![]()
A)economic power is
Unlock this Answer For Free Now!
View this answer and more for free by performing one of the following actions

Scan the QR code to install the App and get 2 free unlocks

Unlock quizzes for free by uploading documents