The diagram below shows the demand and supply curves in a perfectly competitive market.
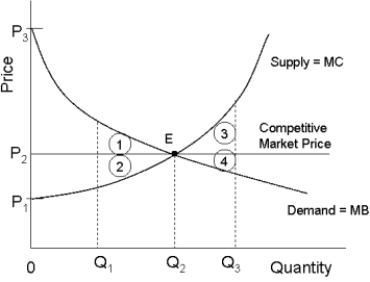 FIGURE 12- 5
-Refer to Figure 12- 5.If output in this market were Q1,and the price were still equal to its free- market level,the loss in producer surplus relative to the competitive equilibrium would be illustrated by area
A) P1P3E.
B) 2.
C) 1.
D) 1 + 2.
E) P3P2E.
Correct Answer:
Verified
Q32: The diagram below shows supply,demand,and quantity exchanged
Q33: If all firms are profit maximizers,then the
Q34: Consider the efficiency of various market structures
Q35: The diagram below shows supply,demand,and quantity exchanged
Q38: In general,which of the following statements guides
Q39: FIGURE 12- 1 Consider three firms,A,B and
Q40: The diagram below shows the demand and
Q41: The diagram below shows the market demand
Q42: The diagram below shows the market demand
Q75: The diagram below shows the demand and
Unlock this Answer For Free Now!
View this answer and more for free by performing one of the following actions

Scan the QR code to install the App and get 2 free unlocks

Unlock quizzes for free by uploading documents