The diagram below shows the market demand curve and the cost curves for a single firm.
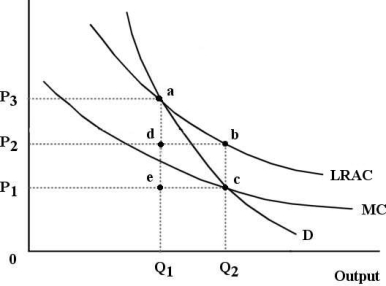 FIGURE 12- 6
-Refer to Figure 12- 6.The firm depicted in the figure is
A) a perfectly competitive firm.
B) a cartel.
C) a monopolistically competitive firm.
D) an oligopoly.
E) a natural monopoly.
Correct Answer:
Verified
Q37: The diagram below shows the demand and
Q38: In general,which of the following statements guides
Q39: FIGURE 12- 1 Consider three firms,A,B and
Q40: The diagram below shows the demand and
Q41: The diagram below shows the market demand
Q44: If an economy is productively inefficient,it could
Q45: The diagram below shows the demand and
Q46: In general,the sum of consumer and producer
Q47: Suppose there are only two firms (Firms
Q62: The diagram below shows the demand and
Unlock this Answer For Free Now!
View this answer and more for free by performing one of the following actions

Scan the QR code to install the App and get 2 free unlocks

Unlock quizzes for free by uploading documents