The diagram below shows the market demand curve and the cost curves for a single firm.
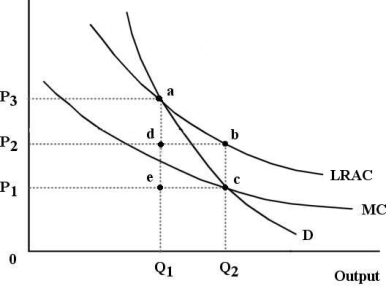 FIGURE 12- 6
-Refer to Figure 12- 6.Suppose this firm is a government- owned natural monopoly and imposes a price so as to achieve allocative efficiency in this market.The amount of tax revenue that the government must raise elsewhere in the economy to offset the losses of this firm is represented by the area
A) 0P2bQ2
B) P1P2bc
C) Q1dbQ2
D) P1P3ae
E) edbc
Correct Answer:
Verified
Q37: The diagram below shows the demand and
Q38: In general,which of the following statements guides
Q39: FIGURE 12- 1 Consider three firms,A,B and
Q40: The diagram below shows the demand and
Q42: The diagram below shows the market demand
Q44: If an economy is productively inefficient,it could
Q45: The diagram below shows the demand and
Q46: In general,the sum of consumer and producer
Q62: The diagram below shows the demand and
Q75: The diagram below shows the demand and
Unlock this Answer For Free Now!
View this answer and more for free by performing one of the following actions

Scan the QR code to install the App and get 2 free unlocks

Unlock quizzes for free by uploading documents