The diagram below shows the marginal costs of pollution abatement for two firms,Firm 1 and Firm 2.
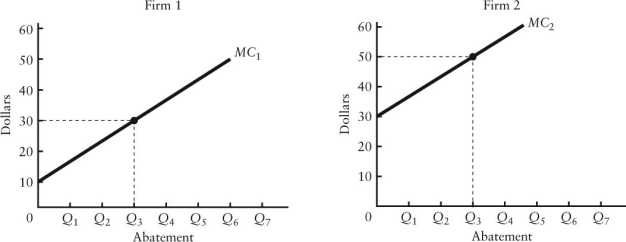 FIGURE 17-5
-Refer to Figure 17-5.If the government requires each firm to abate Q3 units of pollution,the social costs of this abatement
A) would be minimized.
B) could be reduced further if each firm was required to abate more.
C) could be reduced further if Firm 1 increased its abatement and Firm 2 reduced its abatement by the same amount.
D) could be reduced further if Firm 2 increased abatement and Firm 1 reduced its abatement by the same amount.
E) could be reduced further if each firm was allowed to pollute more.
Correct Answer:
Verified
Q41: The table below shows the marginal benefit
Q47: The table below shows the marginal benefit
Q60: The marginal benefit of reducing pollution and
Q61: All of the following are examples of
Q61: The diagram below shows the marginal cost
Q65: The diagram below shows the marginal costs
Q71: Consider two firms,A and B,that must engage
Q72: Two firms,A and B,are legally required to
Q75: Automobile emissions standards are an example of
A)direct
Q79: Direct controls for reducing pollution can be
Unlock this Answer For Free Now!
View this answer and more for free by performing one of the following actions

Scan the QR code to install the App and get 2 free unlocks

Unlock quizzes for free by uploading documents