The diagram below shows a market for tradable pollution permits. 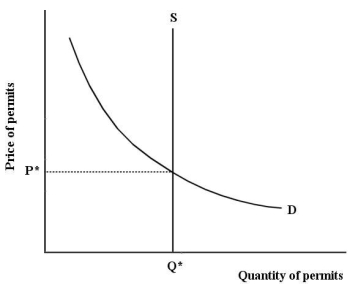 FIGURE 17-8
-Refer to Figure 17-8,which depicts the market for tradable pollution permits.If there is an increase in firms' marginal cost of pollution abatement,
A) firms decide to abate more pollution.
B) the price of pollution permits will fall.
C) firms will demand more pollution permits.
D) firms will demand fewer pollution permits.
E) firms require exactly Q* permits.
Correct Answer:
Verified
Q102: The diagram below shows the marginal cost
Q103: A paper mill discharges chemicals into a
Q104: The diagram below shows a market for
Q105: The diagram below shows the marginal cost
Q106: As a method of pollution control,tradable emissions
Q108: If emissions permits are traded freely between
Q109: The diagram below shows the marginal cost
Q110: The diagram below shows a market for
Q111: Economists often argue that a system of
Q112: Given that different firms typically have different
Unlock this Answer For Free Now!
View this answer and more for free by performing one of the following actions

Scan the QR code to install the App and get 2 free unlocks

Unlock quizzes for free by uploading documents