The diagram below shows the marginal cost of abatement for each of two firms,A and B.Each firm is initially abating Q0 units of pollution. 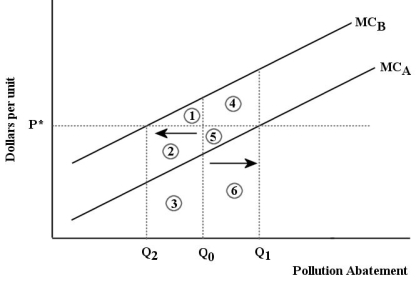 FIGURE 17-7
-Refer to Figure 17-7.Suppose that a system of tradable pollution permits is introduced into this market and the equilibrium permit price is p*.The effect will be that
A) there will be no change in the quantity of abatement by each firm.
B) Firm A will abate less pollution-the amount Q2,and Firm B will abate more pollution-the amount Q1.
C) Firm B will abate less pollution-the amount Q2,and Firm A will abate more pollution-the amount Q1.
D) Firms A and B will each abate Q2 units of pollution.
E) Firms A and B will each abate Q0 units of pollution.
Correct Answer:
Verified
Q97: The diagram below shows the marginal cost
Q98: A potential disadvantage of emissions taxes versus
Q99: If residential garbage collection were financed by
Q100: Direct pollution controls are usually inefficient because
Q101: Consider a coal-fired electric-power plant that is
Q103: A paper mill discharges chemicals into a
Q104: The diagram below shows a market for
Q105: The diagram below shows the marginal cost
Q106: As a method of pollution control,tradable emissions
Q107: The diagram below shows a market for
Unlock this Answer For Free Now!
View this answer and more for free by performing one of the following actions

Scan the QR code to install the App and get 2 free unlocks

Unlock quizzes for free by uploading documents