The diagram below shows a market for tradable pollution permits. 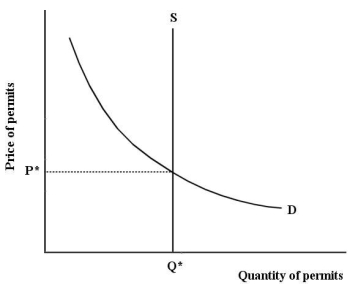 FIGURE 17-8
-Refer to Figure 17-8,which depicts the market for tradable pollution permits.The amount of permits Q* is determined by
A) market forces.
B) large corporations.
C) the level of abatement technology.
D) the World Environmental Organization.
E) the relevant government.
Correct Answer:
Verified
Q108: If emissions permits are traded freely between
Q109: The diagram below shows the marginal cost
Q110: The diagram below shows a market for
Q111: Economists often argue that a system of
Q112: Given that different firms typically have different
Q114: Suppose a firm producing roof shingles imposes
Q115: One possible strategy for efficiently addressing the
Q116: In a competitive market for tradable pollution
Q117: Suppose a competitive market for tradable pollution
Q118: The diagram below shows the marginal cost
Unlock this Answer For Free Now!
View this answer and more for free by performing one of the following actions

Scan the QR code to install the App and get 2 free unlocks

Unlock quizzes for free by uploading documents