 FIGURE 6-11
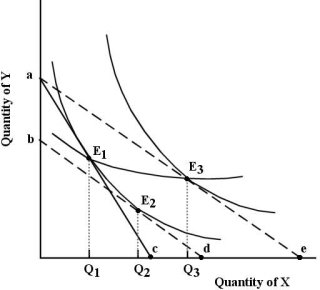
-Refer to Figure 6-11. Suppose the consumer begins at E 1. The income and substitution effects of the reduction in the price of X are represented as follows:
A) the distance Q1d shows the substitution effect and the distance Q2e shows the income effect.
B) the distance de shows the income effect and the distance cd shows the substitution effect.
C) the distance Q1Q2 shows the income effect and the distance Q2Q3 shows the substitution effect.
D) the distance Q1Q2 shows the substitution effect and the distance Q2Q3 shows the income effect.
E) the distance Q1Q3 shows the substitution effect and the distance Q2Q3 shows the income effect.
Correct Answer:
Verified
Q121: Suppose a utility-maximizing person consumes only two
Q122: In indifference curve analysis,the consumer's utility-maximizing point
Q126: Q127: The figures below show Chris's consumption of Q131: Suppose a consumer can purchase only two Q133: The figures below show Chris's consumption of Q135: Q136: Sophie consumes two goods - paperback novels Q139: 6A-4 Deriving the Demand Curve Q139: Unlock this Answer For Free Now! View this answer and more for free by performing one of the following actions Scan the QR code to install the App and get 2 free unlocks Unlock quizzes for free by uploading documents![]()
![]()
-Refer to Figure![]()

