 FIGURE 6-11
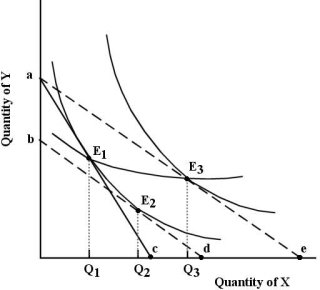
-Refer to Figure 6-11. The line joining points E1 and E3 is known as , which shows how .
A) a price consumption line; consumption changes as one price changes, with money income held constant
B) an income consumption line; consumption changes as income changes, with relative prices held constant
C) a price consumption line; consumption changes as money income and relative prices change
D) an income consumption line; consumption changes with changing relative prices and constant income
Correct Answer:
Verified
Q121: Suppose a utility-maximizing person consumes only two
Q122: In indifference curve analysis,the consumer's utility-maximizing point
Q126: Q127: The figures below show Chris's consumption of Q131: Suppose a consumer can purchase only two Q133: The figures below show Chris's consumption of Unlock this Answer For Free Now! View this answer and more for free by performing one of the following actions Scan the QR code to install the App and get 2 free unlocks Unlock quizzes for free by uploading documents![]()

