The diagram below shows the marginal costs of pollution abatement for two firms, Firm 1 and Firm 2. 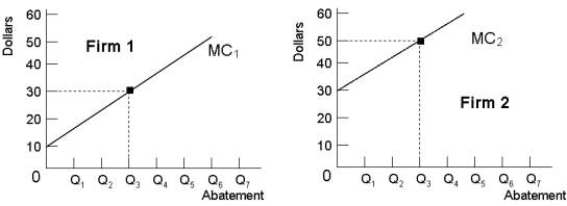 FIGURE 17- 5
-Refer to Figure 17- 5. If the government requires each firm to abate Q3 units of pollution, the social costs of this abatement
A) could be reduced further if Firm 2 increased abatement and Firm 1 reduced its abatement by the same amount.
B) could be reduced further if each firm was required to abate more.
C) could be reduced further if each firm was allowed to pollute more.
D) would be minimized.
E) could be reduced further if Firm 1 increased its abatement and Firm 2 reduced its abatement by the same amount.
Correct Answer:
Verified
Q9: In a competitive market for tradable pollution
Q10: A pollution- control policy that, in principle,
Q11: If a per- unit tax on a
Q12: Consider a coal- fired electric- power plant
Q13: One of the most promising strategies for
Q15: The diagram below shows the marginal cost
Q16: When a farmer in Manitoba produces fertilizer
Q17: The diagram below shows the marginal cost
Q18: Suppose a local meat packing company dumps
Q19: If a negative externality is associated with
Unlock this Answer For Free Now!
View this answer and more for free by performing one of the following actions

Scan the QR code to install the App and get 2 free unlocks

Unlock quizzes for free by uploading documents