The diagram below shows the marginal cost of abatement for each of two firms, A and B. Each firm is initially abating Q0 units of pollution. 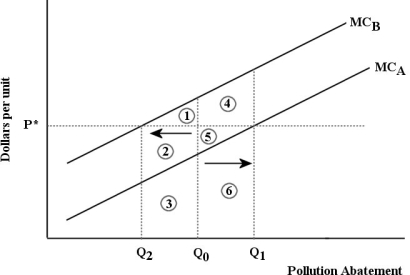 FIGURE 17- 6
-Refer to Figure 17- 6. Suppose that a system of tradable pollution permits is introduced into this market and the equilibrium permit price is p*. Firm B will buy permits from Firm A because
A) its total cost of abating less (areas 1+2+3) exceeds the cost of buying the permits (areas 2+3) .
B) Firm B can buy the permits at a lower price than Firm A.
C) its total savings from abating less (areas 1+2+3) exceed the cost of buying the permits (areas 2+3) .
D) Firm B has lower costs of pollution abatement than Firm A.
E) its total savings from abating less (areas 1+2+3) exceed the total costs of Firm A abating more (area 6) .
Correct Answer:
Verified
Q10: A pollution- control policy that, in principle,
Q11: If a per- unit tax on a
Q12: Consider a coal- fired electric- power plant
Q13: One of the most promising strategies for
Q14: The diagram below shows the marginal costs
Q16: When a farmer in Manitoba produces fertilizer
Q17: The diagram below shows the marginal cost
Q18: Suppose a local meat packing company dumps
Q19: If a negative externality is associated with
Q64: The marginal benefit of reducing pollution and
Unlock this Answer For Free Now!
View this answer and more for free by performing one of the following actions

Scan the QR code to install the App and get 2 free unlocks

Unlock quizzes for free by uploading documents