The diagram below shows the marginal cost of abatement for each of two firms, A and B. Each firm is initially abating Q0 units of pollution. 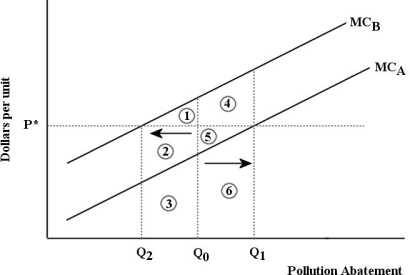 FIGURE 17- 6
-Refer to Figure 17- 6. Suppose that a system of tradable pollution permits is introduced into this market and the equilibrium permit price is p×. Firm A will sell permits to Firm B because
A) Firm B has lower costs of pollution abatement than Firm A.
B) the revenue Firm A earns from selling permits (areas 5 + 6) is greater than the cost it incurs from abating more pollution (area 6) .
C) Firm A can buy the permits at a lower price than Firm B.
D) Firm A's total cost of abating more pollution (area 6) is less than the revenue it earns from selling the permits (areas 4 + 5) .
E) Firm A's total cost of abating more pollution (areas 5 + 6) is less than the revenue it earns from selling the permits (areas 4 + 5 + 6) .
Correct Answer:
Verified
Q12: Consider a coal- fired electric- power plant
Q13: One of the most promising strategies for
Q14: The diagram below shows the marginal costs
Q15: The diagram below shows the marginal cost
Q16: When a farmer in Manitoba produces fertilizer
Q18: Suppose a local meat packing company dumps
Q19: If a negative externality is associated with
Q21: A paper mill discharges chemicals into a
Q22: Federal regulation aimed at reducing greenhouse- gas
Q64: The marginal benefit of reducing pollution and
Unlock this Answer For Free Now!
View this answer and more for free by performing one of the following actions

Scan the QR code to install the App and get 2 free unlocks

Unlock quizzes for free by uploading documents