The diagram below shows the marginal cost of abatement for each of two firms, A and B. Each firm is initially abating Q0 units of pollution. 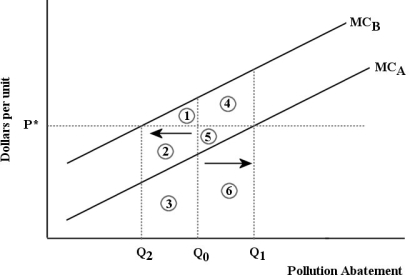 FIGURE 17- 6
-Refer to Figure 17- 6. Suppose that a system of tradable pollution permits is introduced into this market and the equilibrium permit price is p*. The effect will be that
A) Firm B will abate less pollution-the amount Q2, and Firm A will abate more pollution-the amount Q1.
B) Firms A and B will each abate Q0 units of pollution.
C) Firms A and B will each abate Q2 units of pollution.
D) there will be no change in the quantity of abatement by each firm.
E) Firm A will abate less pollution-the amount Q2, and Firm B will abate more pollution-the amount Q1.
Correct Answer:
Verified
Q27: The diagram below shows the marginal cost
Q28: When designing a policy to reduce polluting
Q29: The diagram below show the private and
Q30: The figure below shows the demand and
Q31: The main advantage of using market- based
Q34: If the government imposes a tax for
Q35: The optimal amount of pollution abatement is
Q36: A policy that puts a price on
Q37: Consider the following equation:
Q96: The use of emissions taxes as a
Unlock this Answer For Free Now!
View this answer and more for free by performing one of the following actions

Scan the QR code to install the App and get 2 free unlocks

Unlock quizzes for free by uploading documents