The figure below shows the demand and supply curves for pollution abatement. 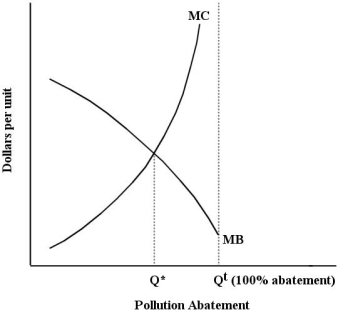 FIGURE 17- 3
-Refer to Figure 17- 3. The socially optimal amount of pollution is
A) Qt - Q*.
B) Q* + Qt.
C) 0.
D) Q*.
E) Qt.
Correct Answer:
Verified
Q25: Consider the following equation:
Q26: When an external cost associated with the
Q27: The diagram below shows the marginal cost
Q28: When designing a policy to reduce polluting
Q29: The diagram below show the private and
Q31: The main advantage of using market- based
Q32: The diagram below shows the marginal cost
Q34: If the government imposes a tax for
Q35: The optimal amount of pollution abatement is
Q96: The use of emissions taxes as a
Unlock this Answer For Free Now!
View this answer and more for free by performing one of the following actions

Scan the QR code to install the App and get 2 free unlocks

Unlock quizzes for free by uploading documents