The figure below shows the marginal benefit to consumers, MB, the marginal cost to private firms, MCp, and the marginal cost to society, MCs, at each level of output of some good. 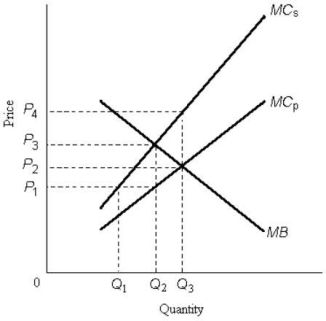 FIGURE 17- 1
-Refer to Figure 17- 1. The price that leads consumers to demand the socially optimal quantity of output is
A) P3.
B) P2.
C) P1.
D) zero.
E) not possible to know from the information given.
Correct Answer:
Verified
Q34: If the government imposes a tax for
Q35: The optimal amount of pollution abatement is
Q36: A policy that puts a price on
Q37: Consider the following equation:
Q38: Global GHG emission reductions are unlikely to
Q40: Direct pollution controls can be criticized from
Q41: A paper mill discharges chemicals into a
Q42: The diagram below shows the marginal cost
Q43: The diagram below shows the market for
Q44: Consider the following equation:
Unlock this Answer For Free Now!
View this answer and more for free by performing one of the following actions

Scan the QR code to install the App and get 2 free unlocks

Unlock quizzes for free by uploading documents