The diagram below shows the marginal cost of pollution abatement for two firms, Firm X and Firm Y. 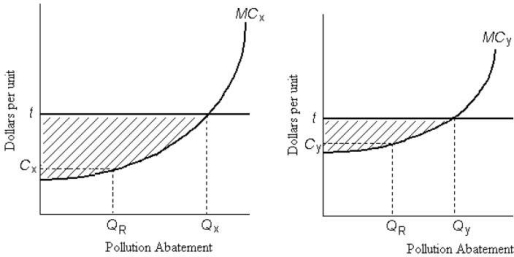 FIGURE 17- 4
-Refer to Figure 17- 4. Firms X and Y have an emissions tax of $t imposed on each unit of pollution they produce. Firm X will choose to abate pollution of units and Firm Y will choose to abate pollution of units.
A) QR; QY
B) QX; QR
C) QR; QR
D) 0; 0
E) QX; QY
Correct Answer:
Verified
Q37: Consider the following equation:
Q38: Global GHG emission reductions are unlikely to
Q39: The figure below shows the marginal benefit
Q40: Direct pollution controls can be criticized from
Q41: A paper mill discharges chemicals into a
Q43: The diagram below shows the market for
Q44: Consider the following equation:
Q46: If emissions permits are traded freely between
Q47: The table below shows the marginal benefit
Q47: The social marginal cost of the production
Unlock this Answer For Free Now!
View this answer and more for free by performing one of the following actions

Scan the QR code to install the App and get 2 free unlocks

Unlock quizzes for free by uploading documents