The diagram below shows the market for tradable pollution permits. 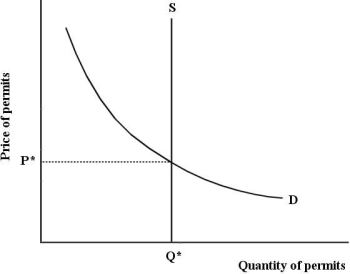 Figure 17- 7
-Refer to Figure 17- 7, which depicts the market for tradable pollution permits. Improvements in firms' abatement technology will be expected to
A) shift the demand curve to the left.
B) shift the supply curve to the right.
C) shift the supply curve to the left.
D) shift the demand curve to the right.
E) not have any impact on the equilibrium.
Correct Answer:
Verified
Q38: Global GHG emission reductions are unlikely to
Q39: The figure below shows the marginal benefit
Q40: Direct pollution controls can be criticized from
Q41: A paper mill discharges chemicals into a
Q42: The diagram below shows the marginal cost
Q44: Consider the following equation:
Q46: If emissions permits are traded freely between
Q47: The table below shows the marginal benefit
Q47: The social marginal cost of the production
Q48: Between 1990 and 2004, Canada's greenhouse gas
Unlock this Answer For Free Now!
View this answer and more for free by performing one of the following actions

Scan the QR code to install the App and get 2 free unlocks

Unlock quizzes for free by uploading documents