The diagram below shows the marginal cost of pollution abatement for two firms, Firm X and Firm Y. 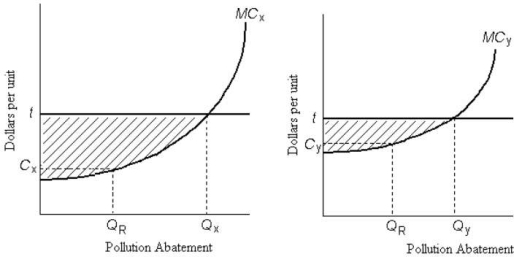 FIGURE 17- 4
-Refer to Figure 17- 4. Ignore the horizontal line at t. If the government wanted to impose an emissions tax, efficiency requires that it
A) impose the same tax on both firms and also fix the amount of pollution abatement at QR for each firm.
B) tax only the low- cost firm (Firm X) and fix the amount of pollution abatement for the high- cost firm (Firm Y) .
C) choose a different tax rate for each firm so that each firm abates QR units of pollution.
D) levy a tax at the same rate to both firms.
E) tax only the high- cost firm (Firm Y) and fix the amount of pollution abatement for the low- cost firm (Firm X) .
Correct Answer:
Verified
Q53: Consider two firms, A and B, that
Q54: The diagram below shows the marginal costs
Q55: All of the following are examples of
Q56: A paper mill discharges chemicals into a
Q57: In 2006, Professor Nicolas Stern of the
Q59: Suppose the government imposes an emissions tax
Q60: When designing a policy to reduce polluting
Q61: A paper mill discharges chemicals into a
Q62: The figure below shows the marginal benefit
Q63: Private and competitive markets could produce efficient
Unlock this Answer For Free Now!
View this answer and more for free by performing one of the following actions

Scan the QR code to install the App and get 2 free unlocks

Unlock quizzes for free by uploading documents