The diagram below shows the demand and supply curves in a perfectly competitive market. 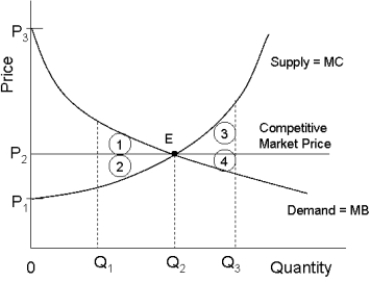 FIGURE 12- 5
-Refer to Figure 12- 5. If output in this market were Q3, and the price was still equal to its
Free- market level, the loss in producer surplus relative to the competitive equilibrium would be illustrated by area
A) 3 + 4.
B) 4.
C) 1.
D) 2.
E) 3.
Correct Answer:
Verified
Q2: If the total output of some industry
Q3: Choose the statement that best compares the
Q4: All points on a country's production possibilities
Q5: Q6: Monopoly is allocatively inefficient because Q7: The diagram below shows the market demand Q8: Choose the statement that best describes the Q9: In many cases throughout Canadian history, governments Q10: Suppose we compare two monopolists with identical Q11: In general, the sum of consumer and![]()
A) the price
Unlock this Answer For Free Now!
View this answer and more for free by performing one of the following actions

Scan the QR code to install the App and get 2 free unlocks

Unlock quizzes for free by uploading documents