The diagram below shows the demand and supply curves in a perfectly competitive market. 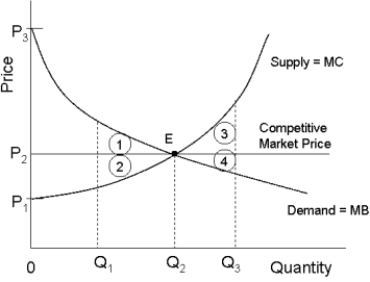 FIGURE 12- 5
-Refer to Figure 12- 5. If output in this market were Q1, and the price were still equal to its
Free- market level, the loss in producer surplus relative to the competitive equilibrium would be illustrated by area
A) P3P2E.
B) P1P3E.
C) 2.
D) 1.
E) 1 + 2.
Correct Answer:
Verified
Q69: Allocative efficiency concerns
A) the allocation of resources
Q70: Consider two firms, A and B, that
Q71: The production possibilities boundary shows possible combinations
Q72: The production possibilities boundary shows possible combinations
Q73: The diagram below shows cost and revenue
Q75: The diagram below shows supply, demand, and
Q76: One method of regulating a natural monopoly
Q77: A natural monopoly exists when
A) a firm
Q78: The diagram below shows supply, demand, and
Q79: ![]()
Unlock this Answer For Free Now!
View this answer and more for free by performing one of the following actions

Scan the QR code to install the App and get 2 free unlocks

Unlock quizzes for free by uploading documents