The production possibilities boundary shows possible combinations of guns and butter that can be produced by a country. The lower diagram shows demand and supply for butter. 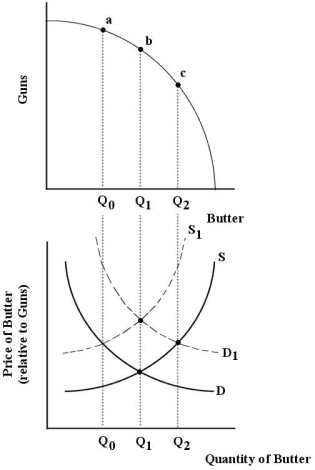 FIGURE 12- 2
-Refer to Figure 12- 2. Suppose this economy is allocatively efficient at Q1 units of butter. Now suppose there is an increase in demand for butter from D to D1. After this shift in demand,
A) the price of guns (relative to the price of butter) rises and the economy moves to point (a) on the PPB.
B) the marginal value to consumers of butter is greater than the marginal cost to producers; the price of butter (relative to the price of guns) rises; the economy moves to output Q2 of butter and point (c) on the PPB.
C) the supply curve will shift up to S1 and allocative efficiency will be maintained.
D) the marginal value to consumers of butter is less than the marginal cost to producers; the price of butter (relative to the price of guns) rises; the economy moves to output Q2 of butter and point (c) on the PPB.
E) the increase in the price of butter (relative to the price of guns) will cause the demand curve to shift back down to D and allocative efficiency will be maintained.
Correct Answer:
Verified
Q67: Allocative efficiency is a property of the
Q68: The diagram below shows cost and revenue
Q69: Allocative efficiency concerns
A) the allocation of resources
Q70: Consider two firms, A and B, that
Q71: The production possibilities boundary shows possible combinations
Q73: The diagram below shows cost and revenue
Q74: The diagram below shows the demand and
Q75: The diagram below shows supply, demand, and
Q76: One method of regulating a natural monopoly
Q77: A natural monopoly exists when
A) a firm
Unlock this Answer For Free Now!
View this answer and more for free by performing one of the following actions

Scan the QR code to install the App and get 2 free unlocks

Unlock quizzes for free by uploading documents