The production possibilities boundary shows possible combinations of guns and butter that can be produced by a country. The lower diagram shows demand and supply for butter. 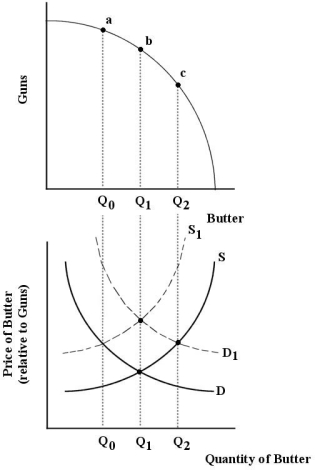 FIGURE 12- 2
-Refer to Figure 12- 2. Suppose demand and supply for butter are shown by D and S, respectively. And suppose the economy is at point (a) on the production possibilities boundary. How can this economy move toward allocative efficiency?
A) produce more butter, less guns.
B) increase the demand for butter.
C) produce less butter, more guns.
D) expand the production possibilities boundary outward.
E) increase the supply of guns.
Correct Answer:
Verified
Q66: The diagram below shows the demand and
Q67: Allocative efficiency is a property of the
Q68: The diagram below shows cost and revenue
Q69: Allocative efficiency concerns
A) the allocation of resources
Q70: Consider two firms, A and B, that
Q72: The production possibilities boundary shows possible combinations
Q73: The diagram below shows cost and revenue
Q74: The diagram below shows the demand and
Q75: The diagram below shows supply, demand, and
Q76: One method of regulating a natural monopoly
Unlock this Answer For Free Now!
View this answer and more for free by performing one of the following actions

Scan the QR code to install the App and get 2 free unlocks

Unlock quizzes for free by uploading documents