The graph in Figure 3-34 illustrates the relationship between reaction rates and substrate concentration for an enzyme-catalyzed reaction.What does the Km value indicate with respect to enzyme-substrate interactions? 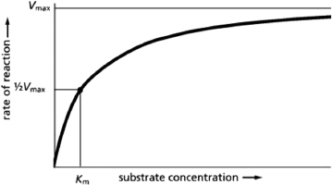 Figure 3-34
A) the maximum rate of catalysis
B) the number of enzyme active sites
C) the enzyme-substrate binding affinity
D) the equilibrium rate of catalysis
Correct Answer:
Verified
Q25: The maximum velocity (Vmax) of an enzymatic
Q26: When the polymer X-X-X ...is broken down
Q27: The net distance a molecule travels through
Q28: In the case of a simple conversion
Q29: The study of enzyme kinetics is usually
Q31: The equilibrium constant for complex formation between
Q32: For the reaction Y→X at standard conditions
Q33: The potential energy stored in high-energy bonds
Q34: Protein E can bind to two different
Q35: Which of the following statements is FALSE
Unlock this Answer For Free Now!
View this answer and more for free by performing one of the following actions

Scan the QR code to install the App and get 2 free unlocks

Unlock quizzes for free by uploading documents