The graph in Figure 3-34 illustrates the change in the rate of an enzyme-catalyzed reaction as the concentration of substrate is increased.Which of the values listed below is used to calculate the enzyme turnover number? 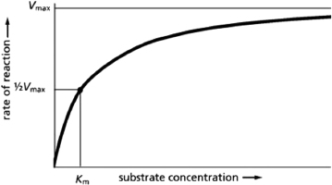 Figure 3-34
A) ½Vmax
B) Km
C) Vmax
D) Vmax − Km
Correct Answer:
Verified
Q17: When elemental sodium is added to water,
Q18: ΔG measures the change of free energy
Q19: Chemical reactions carried out by living systems
Q20: Oxidation is a favorable process in an
Q21: What information regarding an enzyme-catalyzed reaction is
Q23: If proteins A and B have complementary
Q24: Energy cannot be created or destroyed, but
Q25: The maximum velocity (Vmax) of an enzymatic
Q26: When the polymer X-X-X ...is broken down
Q27: The net distance a molecule travels through
Unlock this Answer For Free Now!
View this answer and more for free by performing one of the following actions

Scan the QR code to install the App and get 2 free unlocks

Unlock quizzes for free by uploading documents