Refer to the graph shown. During the Reagan Administration (1981 to 1989) , tax rates were reduced significantly, while federal defense spending rose by 80 percent. The effect of these policies on the AD curve is best shown as a movement from: 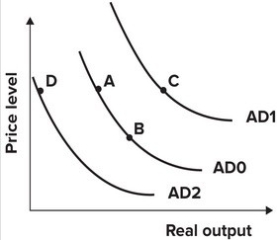
A) A to B.
B) A to C.
C) A to D.
D) B to A.
Correct Answer:
Verified
Q67: The new government of Pakistan transfers money
Q68: To combat inflation in 1955 and 1956,
Q69: If total income in Sweden remains the
Q70: In the summer of 1953, the Korean
Q71: In 1968, the government instituted a 26
Q73: If total income remains the same but
Q74: Refer to the graph shown. In 1930,
Q75: Refer to the graph shown. From 1929
Q76: If the U.S. government increases its expenditures
Q77: If the U.S. government increased taxes without
Unlock this Answer For Free Now!
View this answer and more for free by performing one of the following actions

Scan the QR code to install the App and get 2 free unlocks

Unlock quizzes for free by uploading documents