Refer to the graph shown. In 1930, the United States passed the Smoot-Hawley Tariff Act, which raised tariffs on imported goods at an average of 60 percent. Other countries retaliated with similar tariffs and world output declined. The effect of the decline in foreign output on the U.S. AD curve can be shown by a movement from: 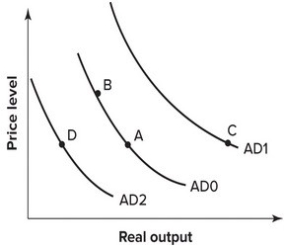
A) A to B.
B) A to C.
C) A to D.
D) B to A.
Correct Answer:
Verified
Q69: If total income in Sweden remains the
Q70: In the summer of 1953, the Korean
Q71: In 1968, the government instituted a 26
Q72: Refer to the graph shown. During the
Q73: If total income remains the same but
Q75: Refer to the graph shown. From 1929
Q76: If the U.S. government increases its expenditures
Q77: If the U.S. government increased taxes without
Q78: Refer to the graph shown. In 1975
Q79: Suppose the Brazilian currency, the real, depreciates
Unlock this Answer For Free Now!
View this answer and more for free by performing one of the following actions

Scan the QR code to install the App and get 2 free unlocks

Unlock quizzes for free by uploading documents