Refer to the graph shown. From 1929 to 1933 the money supply fell in the United States by 40 percent. The effect of this on the AD curve is best shown by a movement from: 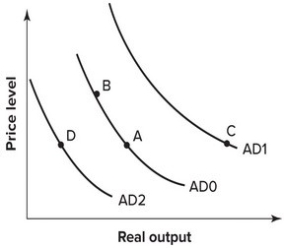
A) A to B.
B) A to C.
C) A to D.
D) B to A.
Correct Answer:
Verified
Q70: In the summer of 1953, the Korean
Q71: In 1968, the government instituted a 26
Q72: Refer to the graph shown. During the
Q73: If total income remains the same but
Q74: Refer to the graph shown. In 1930,
Q76: If the U.S. government increases its expenditures
Q77: If the U.S. government increased taxes without
Q78: Refer to the graph shown. In 1975
Q79: Suppose the Brazilian currency, the real, depreciates
Q80: From 1975 to 1995, the value of
Unlock this Answer For Free Now!
View this answer and more for free by performing one of the following actions

Scan the QR code to install the App and get 2 free unlocks

Unlock quizzes for free by uploading documents