Refer to the graph shown. The market represented here is in equilibrium when the price is: 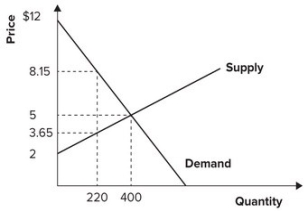
A) $5.00 per unit and 220 units are bought and sold.
B) $8.15 per unit and 220 units are bought and sold.
C) $5.00 per unit and 400 units are bought and sold.
D) $3.65 per unit and 400 units are bought and sold.
Correct Answer:
Verified
Q2: Price ceilings create shortages, but taxes do
Q3: The distance between the demand curve and
Q4: If the minimum that the Smith family
Q7: An excise tax on alcohol causes the
Q9: A price ceiling is, in essence, an
Q15: The more inelastic the demand for agricultural
Q21: Refer to the graph shown. If price
Q22: Refer to the graph shown. If the
Q23: Refer to the graph shown. If the
Q24: Refer to the graph shown. When the
Unlock this Answer For Free Now!
View this answer and more for free by performing one of the following actions

Scan the QR code to install the App and get 2 free unlocks

Unlock quizzes for free by uploading documents