Refer to the graph shown. If the price of this product fell from $10 to $8, producer surplus would fall from: 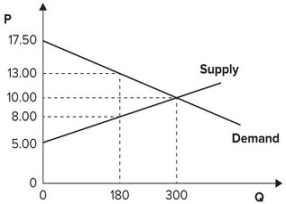
A) 250 to 180.
B) 750 to 540.
C) 750 to 270.
D) 1,000 to 540.
Correct Answer:
Verified
Q2: Price ceilings create shortages, but taxes do
Q4: If the minimum that the Smith family
Q15: The more inelastic the demand for agricultural
Q19: Refer to the graph shown. The market
Q21: Refer to the graph shown. If price
Q23: Refer to the graph shown. If the
Q24: Refer to the graph shown. When the
Q25: Refer to the graph shown. When the
Q26: Refer to the graph shown. When the
Q27: Refer to the graph shown. If the
Unlock this Answer For Free Now!
View this answer and more for free by performing one of the following actions

Scan the QR code to install the App and get 2 free unlocks

Unlock quizzes for free by uploading documents