Refer to the graph shown. If price is increased from $3 to $4, consumer surplus will fall by: 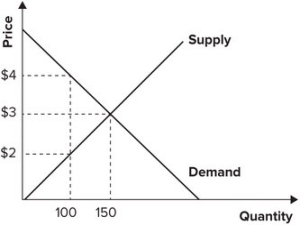
A) 25.
B) 50.
C) 100.
D) 125.
Correct Answer:
Verified
Q2: Price ceilings create shortages, but taxes do
Q3: The distance between the demand curve and
Q4: If the minimum that the Smith family
Q15: The more inelastic the demand for agricultural
Q19: Refer to the graph shown. The market
Q22: Refer to the graph shown. If the
Q23: Refer to the graph shown. If the
Q24: Refer to the graph shown. When the
Q25: Refer to the graph shown. When the
Q26: Refer to the graph shown. When the
Unlock this Answer For Free Now!
View this answer and more for free by performing one of the following actions

Scan the QR code to install the App and get 2 free unlocks

Unlock quizzes for free by uploading documents