The figure below illustrates a stellar spectrum.The dip in the data near 650 nm corresponds most closely with which of the following? 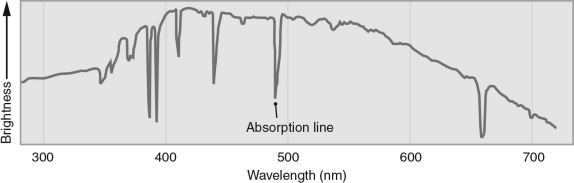
A) sodium emission
B) sodium absorption
C) hydrogen emission
D) hydrogen absorption
E) iron absorption
Correct Answer:
Verified
Q22: In the energy level diagram shown in
Q23: If the frequency of a beam of
Q24: Which of these objects would emit an
Q25: The n = 5 electronic energy level
Q26: When an electron moves from a higher
Q28: In the energy level diagram shown in
Q29: The frequency of a wave is
A) the
Q30: Light with a wavelength of 600 nm
Q31: In the energy level diagram shown in
Q32: In the quantum mechanical view of the
Unlock this Answer For Free Now!
View this answer and more for free by performing one of the following actions

Scan the QR code to install the App and get 2 free unlocks

Unlock quizzes for free by uploading documents