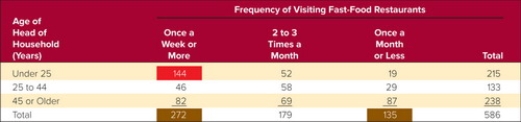
 Figure 8-6AConsider Figure 8-6A above. Suppose you are an owner of a local Wendy's restaurant near a large urban college or university. You hired a marketing research firm to conduct a survey among a sample of respondents in your area to find out their patronage of fast-food restaurants. Four weeks after the firm conducted the survey, it presented the following results to you. What does this figure represent?
A) a trend extrapolation
B) a Likert scale report
C) a perceptual map
D) a cross tabulation
E) a marketing input report
Correct Answer:
Verified
Q248: Q249: All of these are advantages to using Q250: Q251: The two aspects of the process for Q252: _ is a type of forecast that Q254: _ involves starting with the last known Q255: Which of the following is one of Q256: Sherrie sold about $800 worth of produce Q257: The total sales of a product that Q258: A direct forecast involves estimating the value![]()
![]()
Unlock this Answer For Free Now!
View this answer and more for free by performing one of the following actions

Scan the QR code to install the App and get 2 free unlocks

Unlock quizzes for free by uploading documents