The following boxplots show monthly sales revenue figures ($ thousands) for a
discount office supply company with locations in three different regions of the U.S.
(Northeast, Southeast, and West).
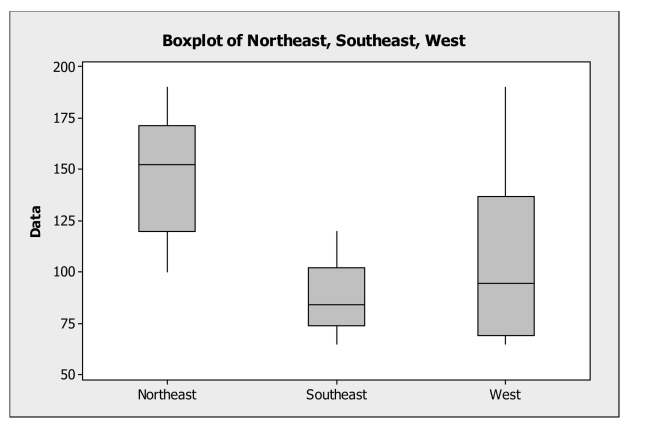
a. Which region has the highest median sales revenue?
b. Which region has the lowest median sales revenue?
c. Which region has the most variable sales revenue values? Explain.
Correct Answer:
Verified
Southeast...
View Answer
Unlock this answer now
Get Access to more Verified Answers free of charge
Q4: Following is a time series graph for
Q5: Following is the five number summary
Q6: Interpret displays of distributions.
-The following boxplots show
Q7: Following is the five number summary
Q8: Compare results using standardization.
-The following table
Q10: Analyze data of quantitative variables.
-The following
Q11: Interpret summary statistics.
-Based on the five
Q12: Analyze data of quantitative variables.
-The following
Q13: Analyze scatterplots and correlation coefficients.
-Suppose the marketing
Q14: Compare results using standardization.
-The following table
Unlock this Answer For Free Now!
View this answer and more for free by performing one of the following actions

Scan the QR code to install the App and get 2 free unlocks

Unlock quizzes for free by uploading documents