Following is a time series graph for monthly closing price of 3M Dental Products
stock (beginning June 2005). 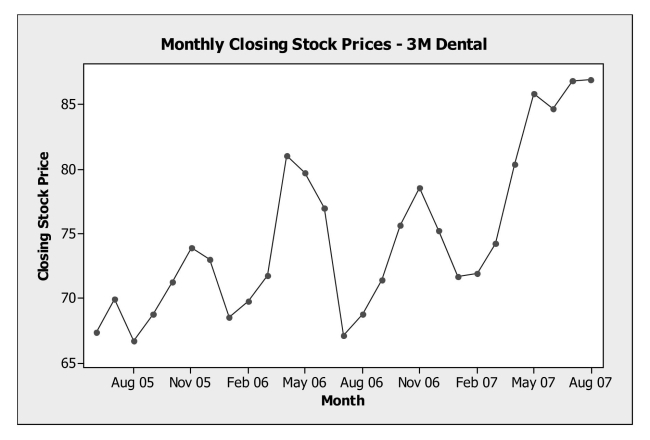
a. Are the closing prices for shares of 3M Dental Products from June 2005 through
August 2007 stationary? Explain.
b. Would a histogram provide a good summary of these stock prices? Explain.
Correct Answer:
Verified
View Answer
Unlock this answer now
Get Access to more Verified Answers free of charge
Q1: Analyze data of quantitative variables.
-The following
Q2: Analyze scatterplots and correlation coefficients.
-For the data
Q3: Analyze data of quantitative variables.
-The following
Q5: Following is the five number summary
Q6: Interpret displays of distributions.
-The following boxplots show
Q7: Following is the five number summary
Q8: Compare results using standardization.
-The following table
Q9: The following boxplots show monthly sales revenue
Q10: Analyze data of quantitative variables.
-The following
Q11: Interpret summary statistics.
-Based on the five
Unlock this Answer For Free Now!
View this answer and more for free by performing one of the following actions

Scan the QR code to install the App and get 2 free unlocks

Unlock quizzes for free by uploading documents