Interpret displays of distributions.
-The following boxplots show monthly sales revenue figures ($ thousands) for a
Discount office supply company with locations in three different regions of the U.S.
(Northeast, Southeast, and West) . Which of the following statements is true? 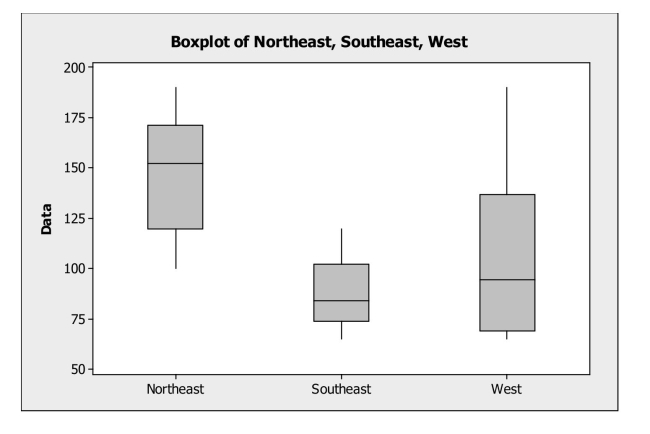
A) The northeast has the lowest mean sales revenue.
B) The southeast has the lowest median sales revenue.
C) The west has the lowest mean sales revenue.
D) The west has the lowest median sales revenue.
E) None of the above.
Correct Answer:
Verified
Q1: Analyze data of quantitative variables.
-The following
Q2: Analyze scatterplots and correlation coefficients.
-For the data
Q3: Analyze data of quantitative variables.
-The following
Q4: Following is a time series graph for
Q5: Following is the five number summary
Q7: Following is the five number summary
Q8: Compare results using standardization.
-The following table
Q9: The following boxplots show monthly sales revenue
Q10: Analyze data of quantitative variables.
-The following
Q11: Interpret summary statistics.
-Based on the five
Unlock this Answer For Free Now!
View this answer and more for free by performing one of the following actions

Scan the QR code to install the App and get 2 free unlocks

Unlock quizzes for free by uploading documents