A hypothesis test for a population mean is to be performed. The hypotheses are
Which of the sketches below could represent the power curve for the test?
A) 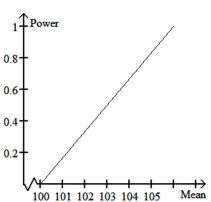
B) 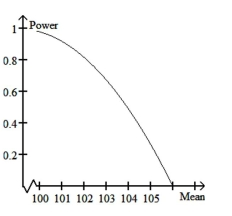
C) 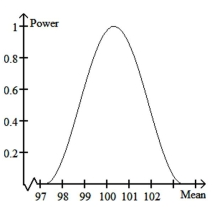
D) 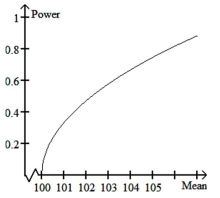
Correct Answer:
Verified
Q15: Solve the problem. Use the critical-value approach.
-A
Q16: Construct a graph portraying the decision
Q17: Solve the problem. Use the critical-value
Q18: Solve the problem. Use the critical-value
Q19: Provide an appropriate response.
-Suppose that you want
Q21: Two graphical displays are given for a
Q22: In 1995, the mean math SAT
Q23: Construct a graph portraying the decision criterion
Q24: Preliminary data analyses indicate that it
Q25: Construct a graph portraying the decision criterion
Unlock this Answer For Free Now!
View this answer and more for free by performing one of the following actions

Scan the QR code to install the App and get 2 free unlocks

Unlock quizzes for free by uploading documents